What the diagrams mean in our posts
 Kim Warren
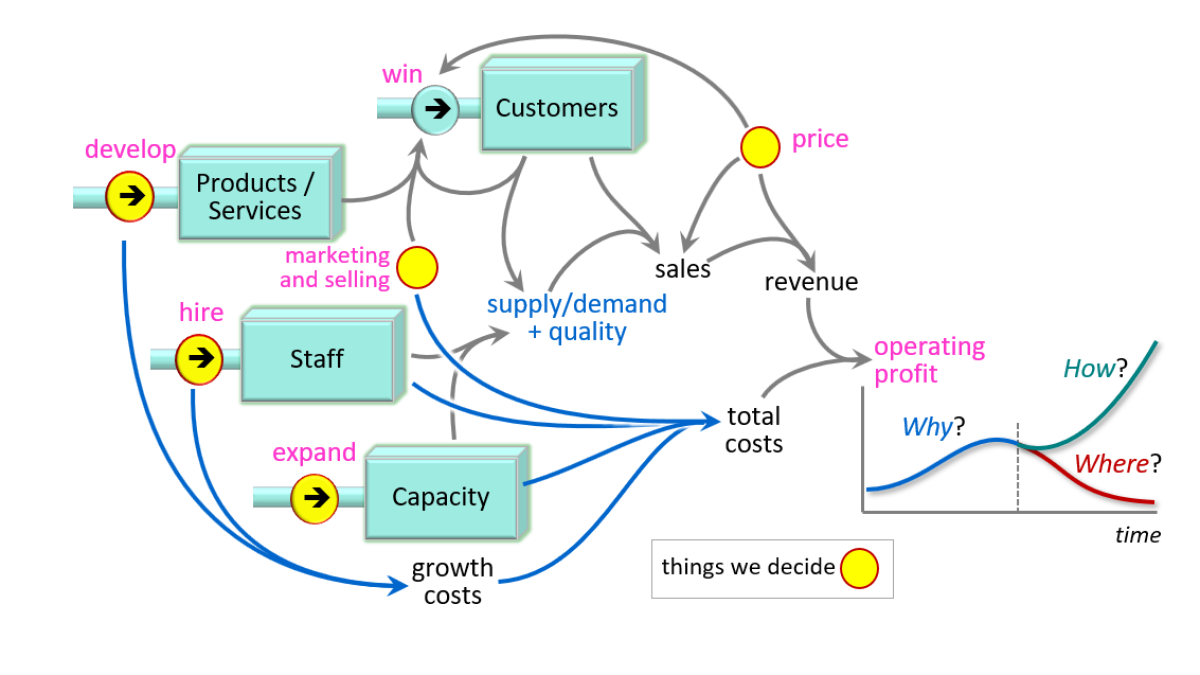
Word-and-arrow diagrams are everywhere in management writing, but ours have very specific meanings. This makes our frameworks rigorous and reliable.
Word-and-arrow diagrams are everywhere!
Such diagrams are very common in management articles and books. But the word-boxes and arrows have a bewildering variety of implied meanings:
Word boxes may be tangible "things" like customer, cash, inventory, intangibles like quality, morale, data, or conceptual things like value proposition or competitive advantage ... or may be verbs or phrases, like 'create value' or 'delay launch'
Arrows linking word boxes may mean anything from 'after A, do B' to 'we need A before we can get B' to 'there is some vague relationship between A and B'
Rigorous meanings = reliable principles
In contrast, the elements of our diagrams have very specific meanings:
Word boxes are always, and only nouns, often tangible items or indicators, but sometimes intangible but always things that can be detected and measured in the real world - yes, intangibles too!
Arrows always, and only, mean that I can work out the quantitative value of the thing at the end of the arrow (the outcome) if I know the values of items at the start of the arrow (the causes). "Work out" most often means I can actually calculate the outcome's value, but sometimes mean estimate e.g. the number of people who buy something per month as its price changes.
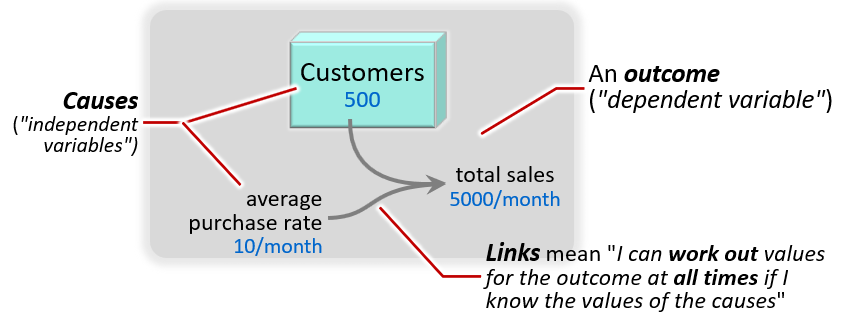
That box is a "stock"
The box is reserved for items that are truly things - tangible or intangible. Most might be thought of as resources, like staff, inventory or reputation (though we only use the word "resources" for such measurable things, not for vague concepts like 'value proposition').
Technically, these items are known as "asset-stocks" or simply stocks, and they turn out to be deeply fundamental to how any business system - or indeed the world in general - actually works.
A stock’s value at any point in time is always, precisely its value at a previous time, plus what's been added, minus what's been lost.
Read more about the nature and importance of stocks at "What is a Stock, and why should I care?"
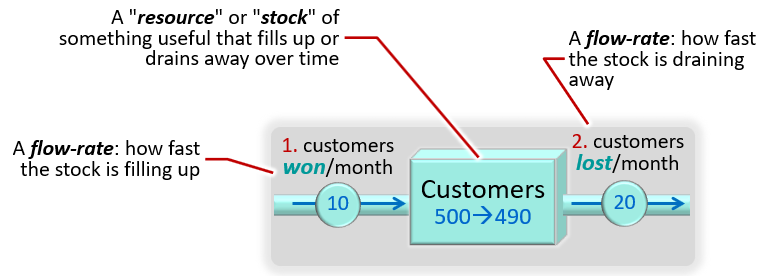
"Flow-rates" fill and drain stocks
Because resource-stocks fill up and drain away over time, it becomes critical how fast that happens.
This is a deeply familiar phenomenon - buy more on your credit card, and the outstanding balance increases; pay off more each month and the balance falls faster. Exactly the same rules apply to those resources:
- Hire more people, and our staff resource grows suffer faster turnover and the number falls
- Win more customers and our customer-base grows - lose more customers to competitors and the customer-base falls
... and the same process applies to our product range, cash, capacity, debt, inventory, order-book - including intangibles like staff-skills, product appeal
These "flow-rates" turn out to be critical to business performance, because if the resource-stocks don't change, then performance does not change, and the only way to change any resource-stock is through the rates at which it fills and drains.
Here is the diagram format we will use to show this relationship between a resource and its flow-rates:
From diagram to "digital-twin business model"
Now we know how to calculate all the relationships in these structures, all we need do is repeat the calculation for every period and we can play out how the business system works – or any part of it.
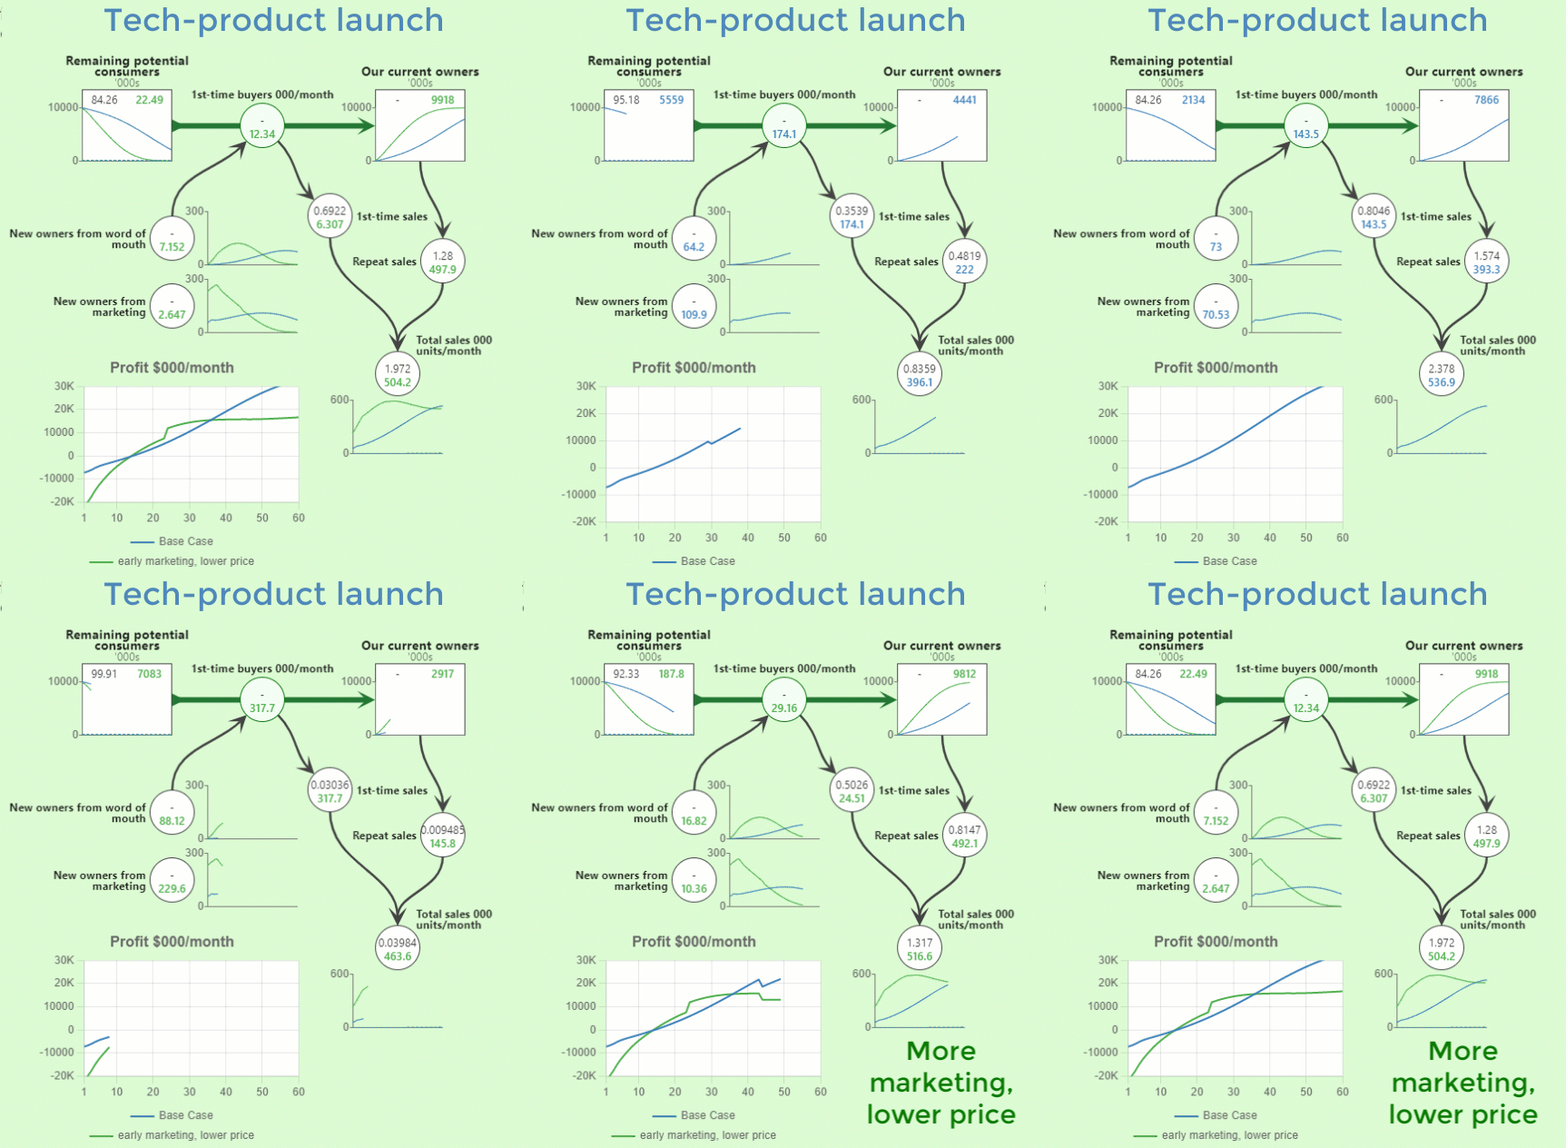
For example, here is part of a model for the launch of a consumer technology product:
Marketing spend and word-of-mouth recommendations win 1st time buyers.
Customers sometimes repurchase, generating repeat sales.
Other parts of the model work out how price affects customer growth and purchase-rates; how rising sales drive down unit costs; how revenue and costs drive profit.
Why do we call these "digital-twin business models"? ... because everything you see matches observable items in the real world - because all relationships work the same way as in the real world - and because the results, and everything driving those results, behaves like the real world. (We can include real-world time series for any element to validate that behaviour).
____________
So remember - when you see our diagrams and models, this - and only this - is what they mean.
Categories: : business modeling