Investment cycles cause boom-bust in many sectors: Exploit the process to win big! (75)
 Kim Warren
Many industries are capital-intensive (some surprisingly so), and suffer investment-driven boom-bust cycles. Understand these and exploit them!
My last post noted that, with few exceptions, economic recessions are led by cut-backs in the corporate sector, not by households or government. You can exploit this process to win big!
I promised to explain where industry cycles come from to cause those recessions – the sum of boom-bust across many sectors.

Get the model (below) of cyclicality in capital intensive industries.
Capacity lead-times and investment confidence
It is all down to a very common issue – that it takes time to add capacity. So there is a long delay from a decision to add capacity and that capacity actually coming on-stream. This is true across surprisingly many industries.
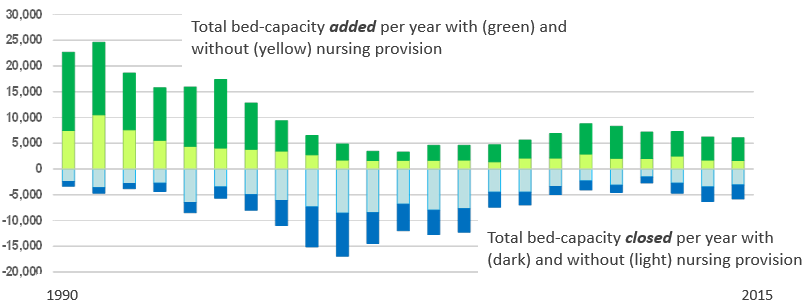
It clearly takes time to build physical manufacturing plant, whether that is for ships, chemicals or microchips. And it takes time to construct new office buildings. A surprising case concerns elderly-care homes ...
But there are more subtle delays too. The insurance industry features a well known “underwriting cycle”. Here, as in many other cases, it takes time for business leaders and investors to have enough confidence in future profitability that new competitors start up. This competes away the strong premiums and profitability, until providers cut the range of insurance they offer or even go bust.
Delays may even arise from staffing capacity. The UK government recently committed (2024) to build 1.5 million new homes over the 5-year election cycle – which would require the construction rate to double throughout that period. But the house-building industry simply does not have the skilled people to do that and will likely take 2+ years to close the gap.
Example: cycles in a manufacturing sector
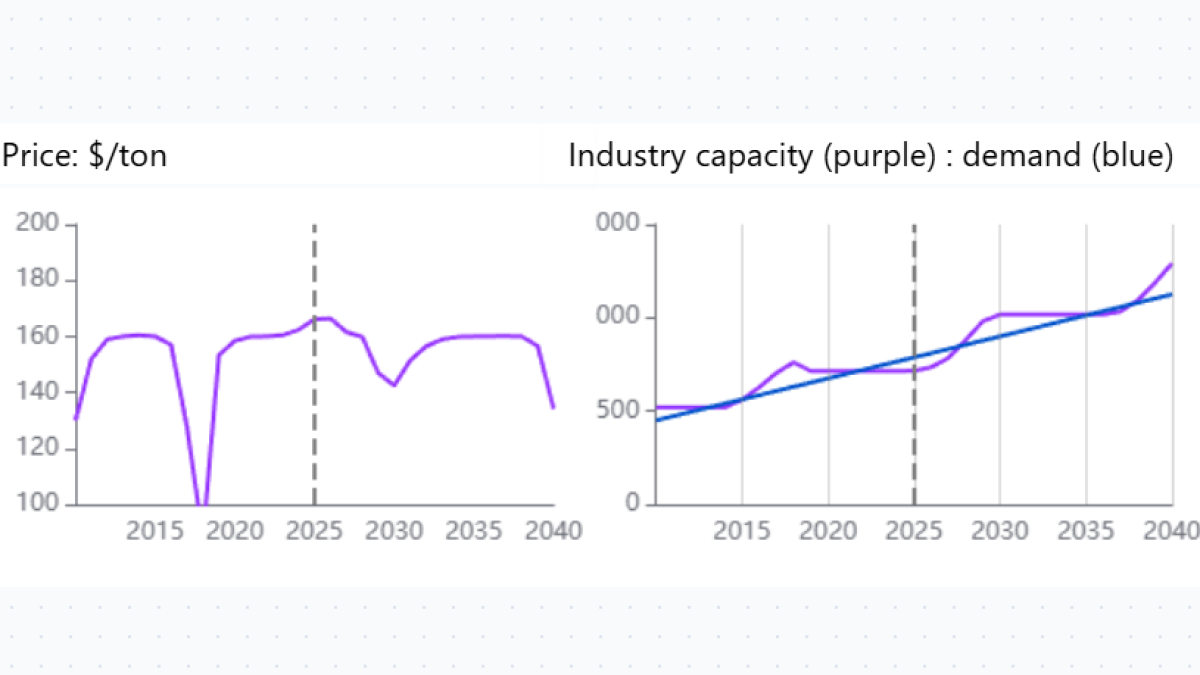
Take an industry producing some widely used material – say petrochemicals, paper-pulp, cement …
- price per ton reflects the demand/supply balance, and can spike sharply when capacity gets tight
- price drives profitability, so profitability too can spike
- high profitability triggers many suppliers to approve the building of new capacity
- which will come on-stream after a construction delay of some years
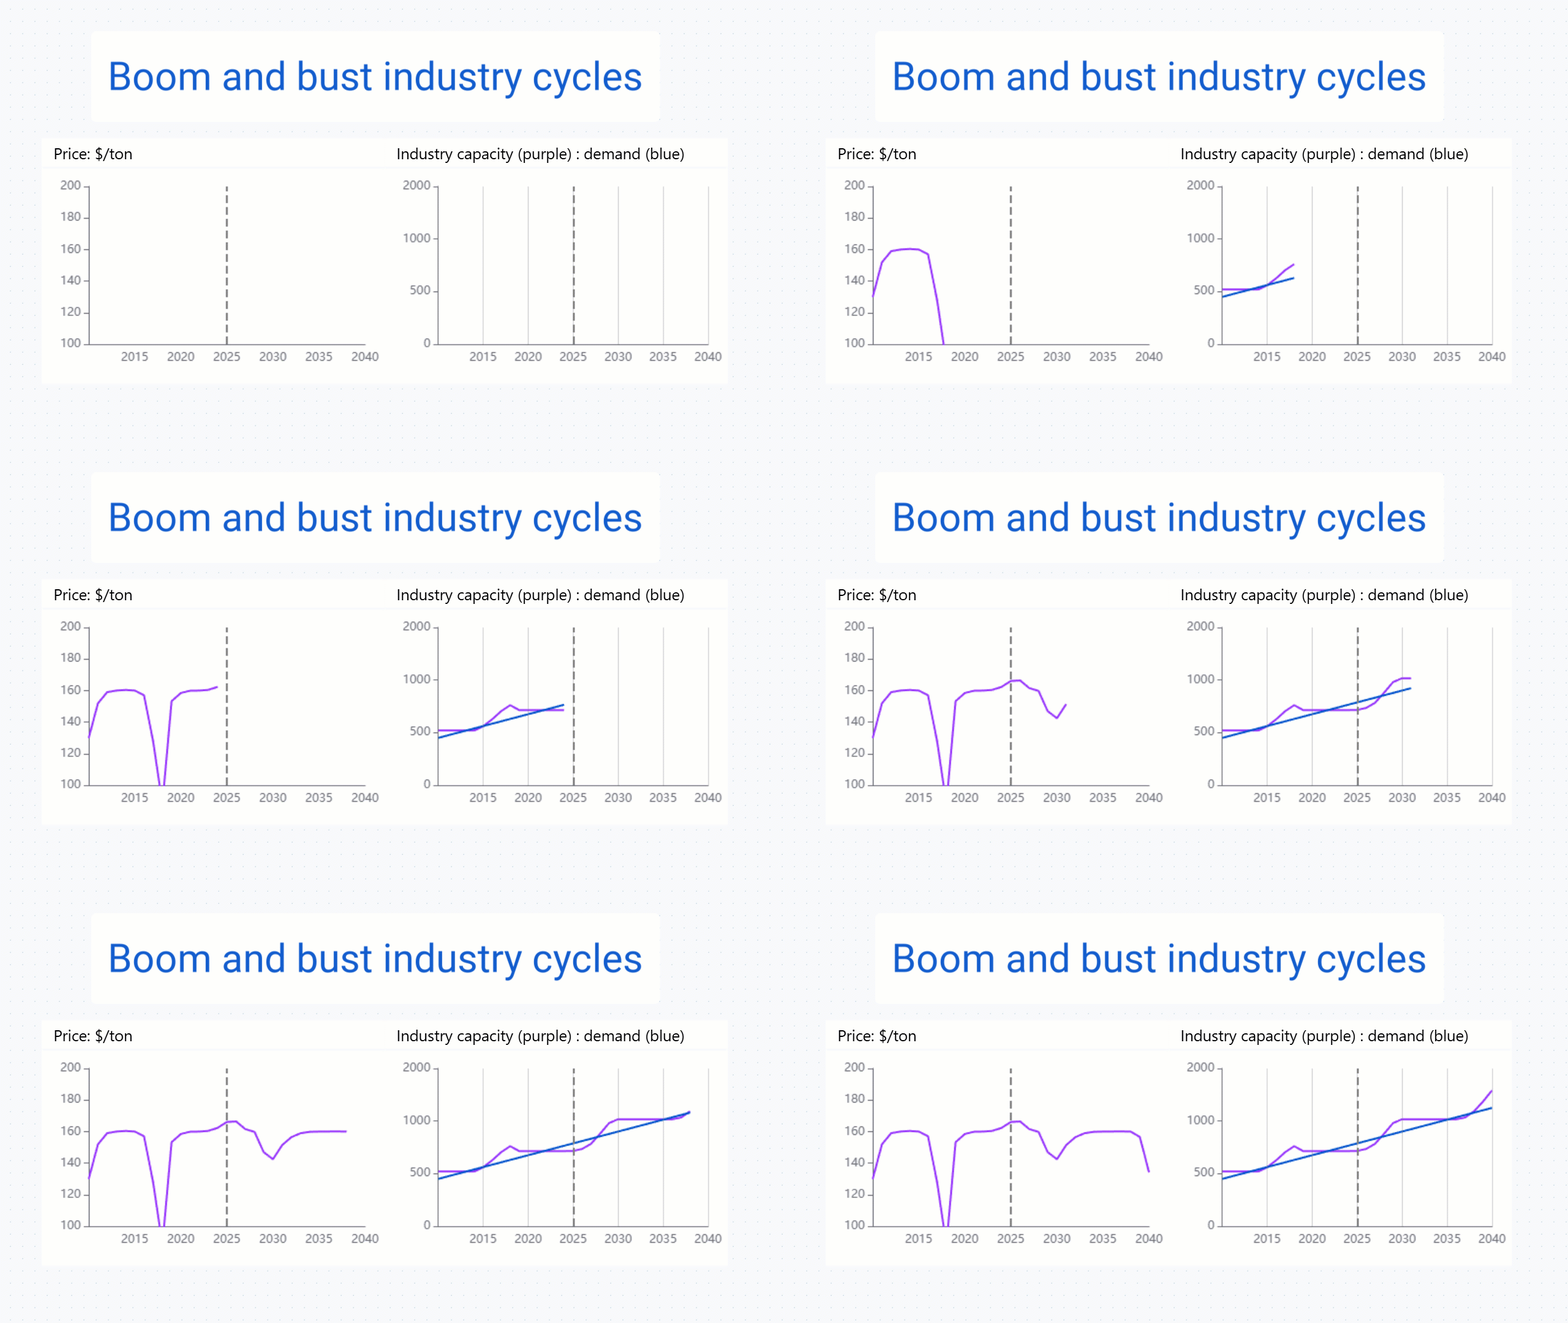
These charts of course come from a dynamic business model, capturing this process for a whole industry.
In the meantime, shortages continue to drive price higher, leading to still-more new capacity. Then:
- when all that capacity comes on-stream, prices collapse
- so profitability falls
- causing capacity to be closed and firms to go bust
- so supply and demand come back into balance, prices recover and the story starts again
It is not hard to see how summing these cycles across many business sectors would explain why it is the corporate sector that leads booms and recessions across an entire economy.
A strategy for exploiting industry cycles
Given this seemingly relentless challenge, what do smart companies do?
- They do not invest in new capacity when prices and profitability are high. Instead they squirrel-away the strong cash-flows.
- When the bust happens, they buy up bankrupt capacity at fire-sale prices
- … and speed up the rebalance of capacity and demand by closing less efficient plant, ensuring that their own profitability is higher than industry average.
Then they wait for the party to start over again!
Categories: : business performance, model available, strategy